The Capital Area United Way received an influx of phone calls as the novel coronavirus was spreading, and lacked a clear picture of where those calls were coming from, and which call types were most prevalent. They needed a way to understand which issues were most pressing, and how this differed by location.
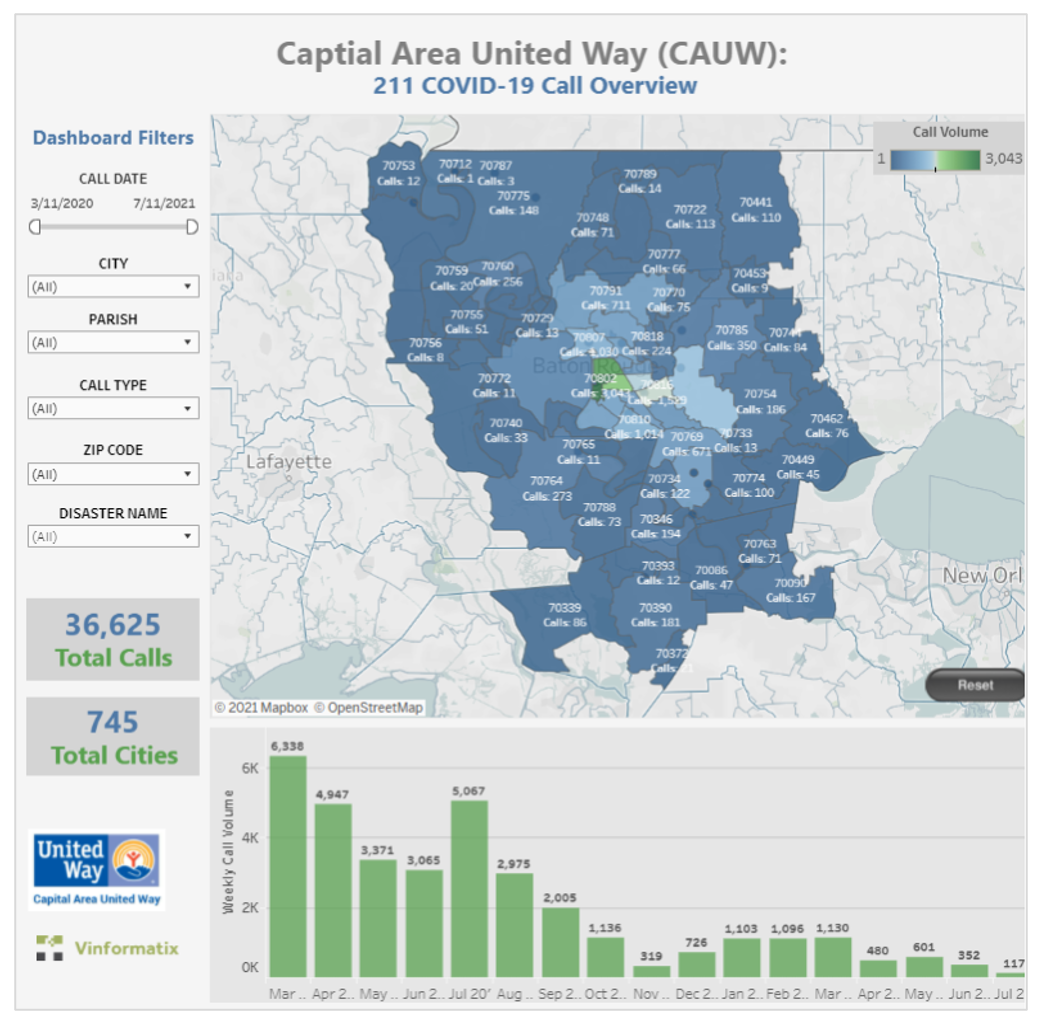
Vinformatix designed an interactive heatmap that intuitively illustrates call volume, and allows the user to filter by call type. The dashboard was developed with Tableau, and published as an embeddable iframe.
CAUW can better anticipate how to connect callers with the resources they need in a fast-changing environment, and can also quickly make reports on a specific time period or location using the interactive filters.